Analysis of FRCR Rapid Reporting:
The Royal College of Radiologists has recently made public an analysis of the FRCR examination based on the Spring 2014 examination. This is a detailed analysis of all components of the FRCR examination. As expected the data is analysed with great statistical detail. Although this is a necessarily comprehensive approach for the RCR a significant amount of key derivable data and conclusions are missed by such an analysis. It also allows us externally to lift up the veil of the exam and explore ways to improve our performance.
I have analysed some of this data myself and come to some important conclusions. This data forms part of a larger document compiled for registrants of the Grayscale Course including a set of 15 simple instructions, rules and "tricks" to help ensure success in the Rapid Reporting section of the FRCR examination. Registrants can download the encrypted full document here:
I have analysed some of this data myself and come to some important conclusions. This data forms part of a larger document compiled for registrants of the Grayscale Course including a set of 15 simple instructions, rules and "tricks" to help ensure success in the Rapid Reporting section of the FRCR examination. Registrants can download the encrypted full document here:
Excerpt:
Point 14. The college likely fiddles the results.
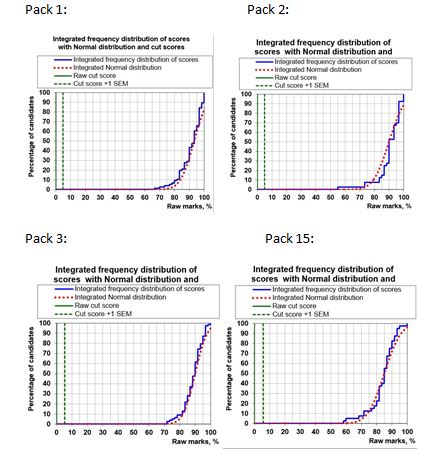
Or so I would hope so. So stop worrying about how difficult your pack was. There is clear variation in the ease of the packets. This is apparent from my analysis of limited data buried within a college review, although the college does not address this. So it is highly likely the college adjusts the converted scores (4-8) accordingly. Why? Have a look at the following raw data from the RCR:
Source: https://www.rcr.ac.uk/sites/default/files/FRCR_Review_Annexes_1A_and_1B.pdf
The graphs below show the raw scores (in % rather than out of 30) for 4 packs in the Spring 2014, exam, below is my analysis:
Here is some of my personal analysis of the curves/data:
Pooled analysis:
*The college reviews the value of every case in the rapid reporting packs to the total discriminatory score. However, it would appear from the data presented above that there is considerable variation in the raw scores achieved between different packs. I would suspect that there is insufficient difference in the candidates in each pool although it is possible that this is a contributory factor. Overall though I would suspect that this means the college then has to apply some normalising factor converting the raw score to the closed marking scoring system to ensure fairness. Otherwise in some data sets the number achieving a ≥27/30 is too variable between 25% and 72%. I do not know this for certain but it would also explain the absence of cut marks/pass scores on the raw data provided as well as the absence of curves related to converted scores.


